H ealthcare is clearly a prime recipient for AI intervention due to the abundance of data that is collected, almost a 1500% increase over the past seven years[2], and the ability to set well defined, objective goals. Therefore, companies such as PathAI are leveraging the power of ML to complete tasks not only faster than a human doctor, but at a fraction of the cost and more accurately. However, the question must be asked... what do we mean by accuracy? What does the accuracy of a machine learning model mean within healthcare and is it the right metric to be tracking?
It must be acknowledged that this is a very large question especially given the range of uses of AI within healthcare:
- Diagnosis
- Treatment protocol development
- Drug development
- Personalized medicine,
- Patient monitoring and care
Accuracy is the measure of the proportion of correctly assigned items within a dataset when making a prediction. However, there are major drawbacks to using accuracy as a measure for the performance of a predictive classification model. Imagine a dataset containing 90 patients with a disease and 10 without. A naïve model that predicts that everyone has the disease would achieve a seemingly phenomenal 90% accuracy, but there is clearly something flawed in this approach.

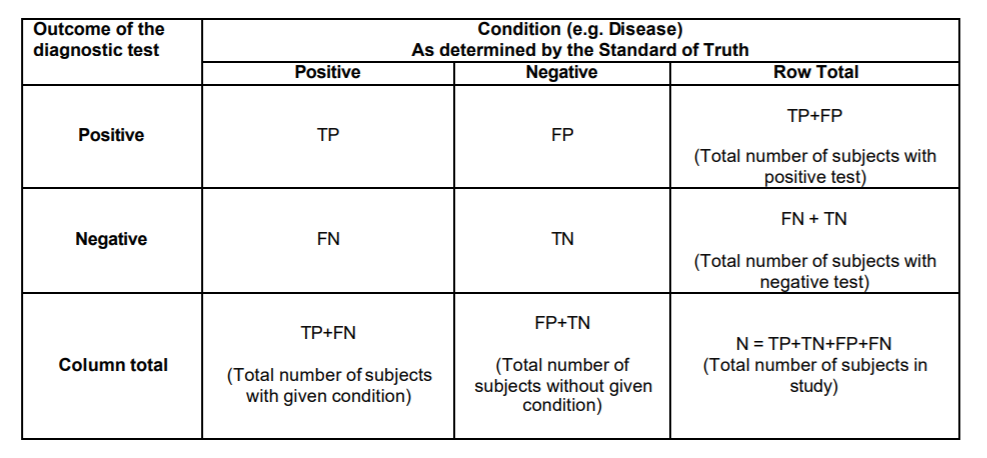
The example above demonstrates how imbalanced datasets can seriously affect whether accuracy alone can evaluate the performance of a model. To understand the drawbacks of the naive model, we must evaluate type 1 and type 2 errors. Where type 1 errors are false positive results- predicting that you have a disease when in fact you do not. Type 2 errors are false negative results- prediciting that you do not have a disease when in fact you do.
Our naïve model above clearly has an abundance of type 1 errors, false positives and thus while accuracy alone may suggest that we have a great model, the abundance of type 1 errors tells us we do not.

Let's dive one step further but first we need to define some terms.
- Sensitivity = TP/(TP + FN) = (Number of true positive assessment)/(Number of all positive assessment)[1]
- Specificity = TN/(TN + FP) = (Number of true negative assessment)/(Number of all negative assessment)[1]
- Accuracy = (TN + TP)/(TN+TP+FN+FP) = (Number of correct assessments)/Number of all assessments)[1]
How do we resolve the flaws in accuracy?
Don't just rely on accuracy
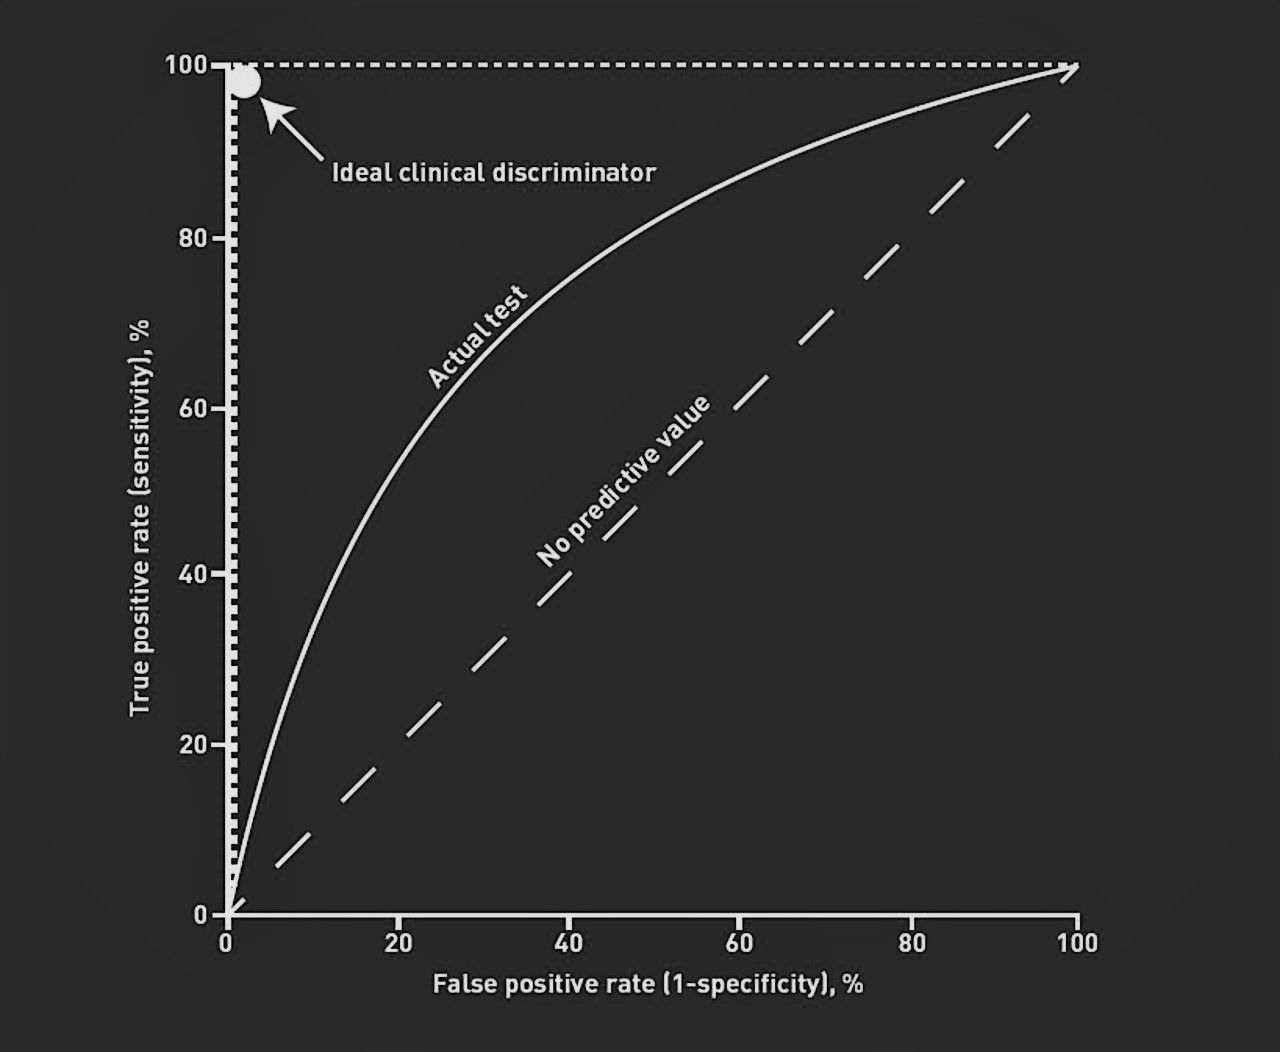
When evaluating the performance of any ML model against a human actor we must compare all of the above parameters before we can comfortably say how well it is performing. A tidy way to visualise this is on a Receiver Operator Characteristic (ROC) curve which is a legacy name from its original use in signal detection theory[3]. The curve plots true positive rate against false positive rate and can be utlised to see how random a models predictions are. The curve also produces a nice metric named "Area Under the Curve (AUC)" which is deemed by many as a better evaluation of the performance of an ML model. The higher the AUC, the better the model's senitivity and specificity. In addition, a human doctor can also be plot on this curve for a direct comparison of the efficacy of the model being implemented.

Bring this back to healthcare
In healthcare, the predictions made by machine learning models can end lives and this leads to distinct expectations when utlising AI. Primarily, the threshold for sensitivity and specificity are not always set at the same level. Someone who has the disease being diagnosed as healthy is the worse case scenario in diagnostics and this naturally leads to an increased demand on the sensitivity rate - the number of false positives must be kept to a minimum. When training deep learning and machine learning models for use in this field, the parameters must be calibrated with this adequate weighting in mind.
The importance of combining accuracy, sensitivity and specificity to evaluate the performance of a model is remarkably clear and it is vital that the public and regulators are aware of the limitations of quoted metrics of success such as accuracy.

References
[1] https://www.lexjansen.com/nesug/nesug10/hl/hl07.pdf
[2] https://www.statista.com/statistics/1037970/global-healthcare-data-volume/#:~:text=The amount of global healthcare,new data generated in 2020.
[3] https://www.displayr.com/what-is-a-roc-curve-how-to-interpret-it/
[4] https://fastdatascience.com/
